By Noa Levy
How UAE Traders React When Bitcoin Falls
With Bitcoin spiraling in the last quarter of 2025, we were curious how UAE traders respond to the volatility. Looking at the data, we found that they’re surprisingly reactive to price movements.
After touching an all-time high of $126,000 in early October 2025, Bitcoin shed nearly a third of its value, dropping below $83,000 at its lowest point in late November. Naturally, moves of this magnitude stir up emotional reactions: crashes incite fear and a flight to safety, while spikes trigger FOMO. We're taught not to be emotional investors, but admittedly, it’s hard.
Lean Technologies powers the payment infrastructure used by the UAE's largest crypto exchanges. Every day, thousands of traders fund their accounts through Lean, giving us a direct view into how money actually moves when the market turns.
With Bitcoin experiencing sharp swings throughout 2025, we asked ourselves: how do UAE traders react to volatility, reconciling human emotions against financial discipline?
The answer is unambiguous. When Bitcoin drops, traders step in.
Buying the dip
Analyzing payment data from the beginning of 2025 across the UAE's major crypto exchanges reveals an unmistakable pattern: traders don't flee Bitcoin crashes, they lean into them.
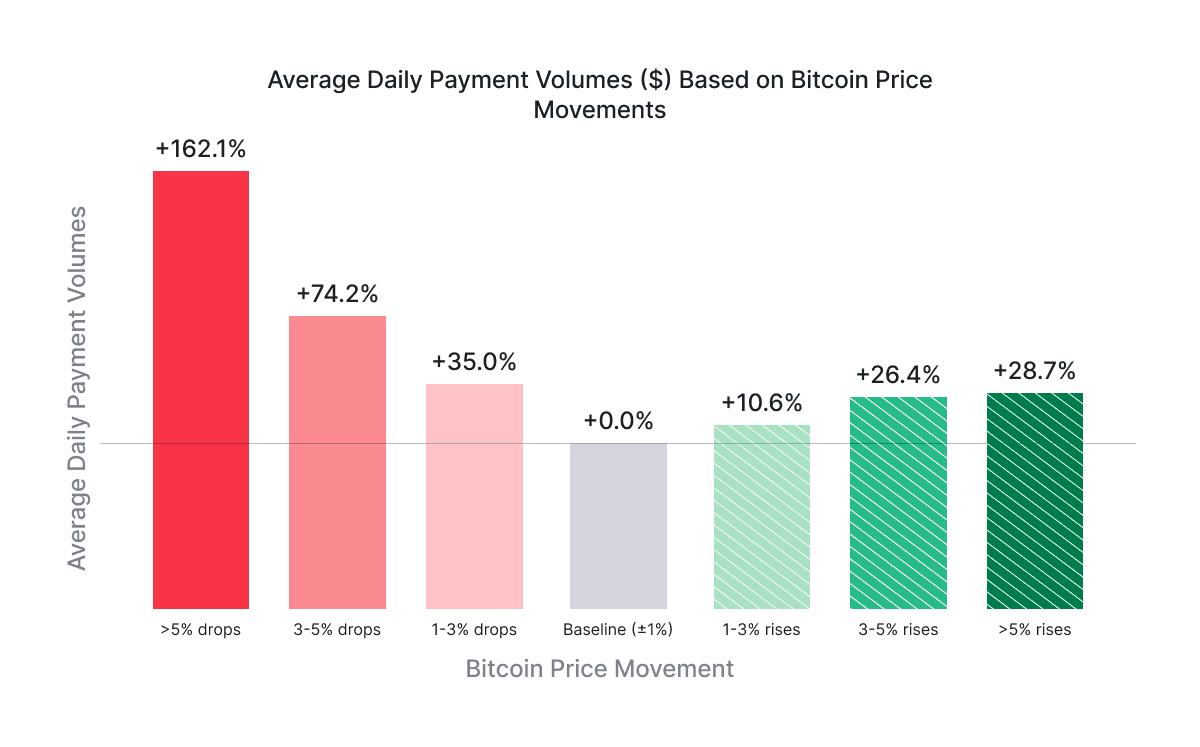
The more Bitcoin drops in a single day, the more aggressively users fund their crypto accounts. And this relationship isn't linear, it's exponential:
• Bitcoin drops of 1-3% trigger a 35% increase in top-up volumes compared to stable markets.
• Drops of 3-5% see funding grow by 74%.
• When Bitcoin plummets more than 5% in a single day, deposits surge by 162%.
That's not a typo. When Bitcoin crashes hardest, traders double and triple-down.
Rallies change surprisingly little
What happens when prices move in the opposite direction? Do traders pull back, expecting better entry points? Do they move capital elsewhere? Or does FOMO kick in when Bitcoin surges, driving them to pile in before missing the rocket ship?
The answer is none of the above. Funding activity during rally days remains largely unchanged from stable conditions. No panic buying. No euphoric capital deployment. Just baseline activity.
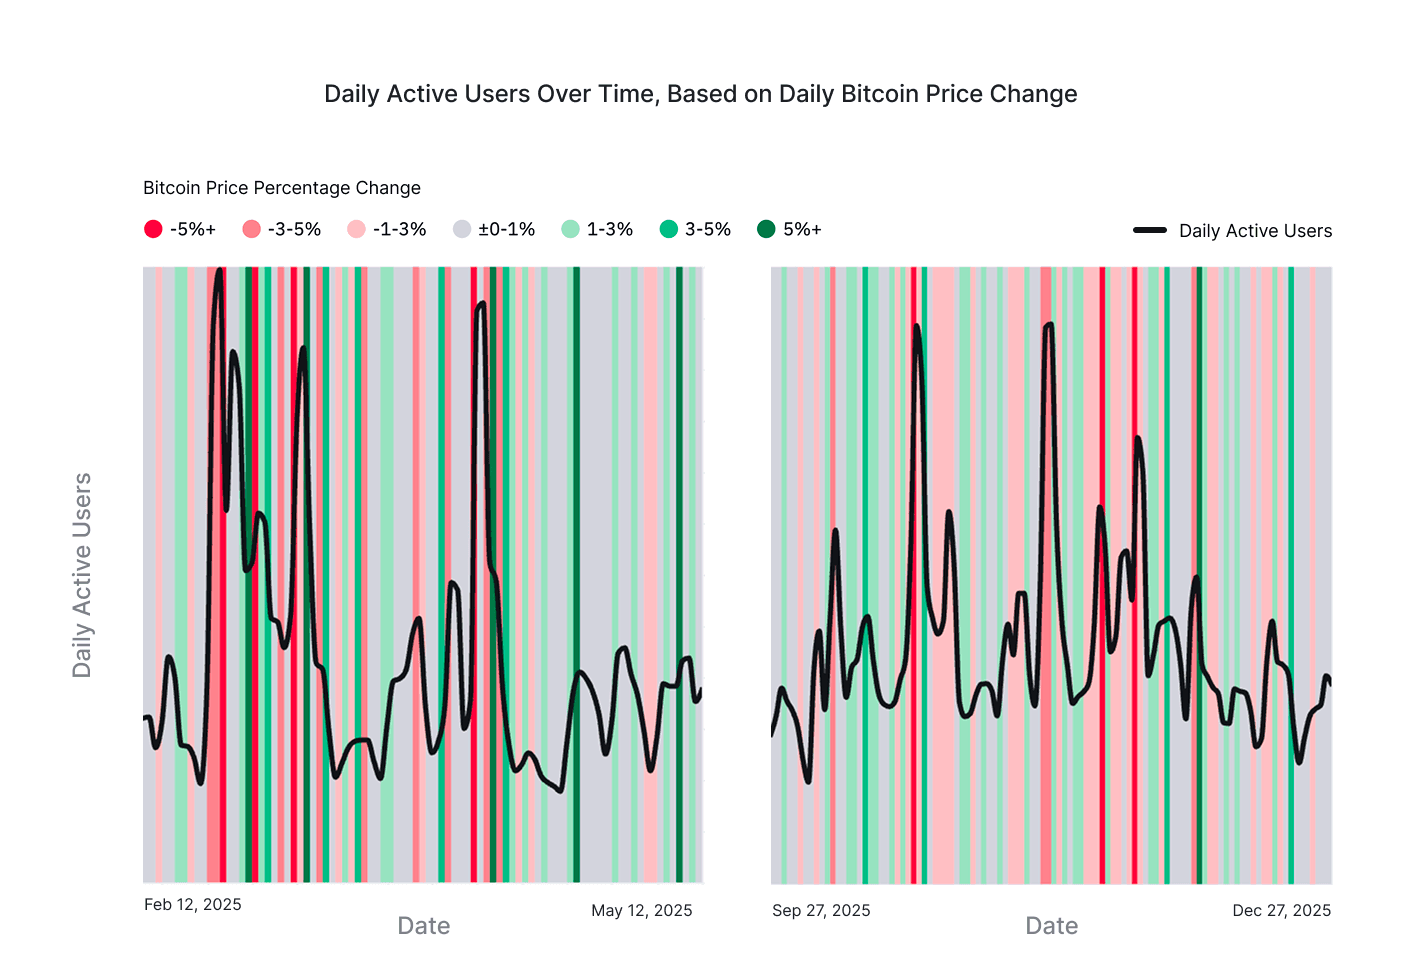
Across 2025, only one type of movement reliably alters behavior: downward volatility.
The whales and the fish follow the same playbook
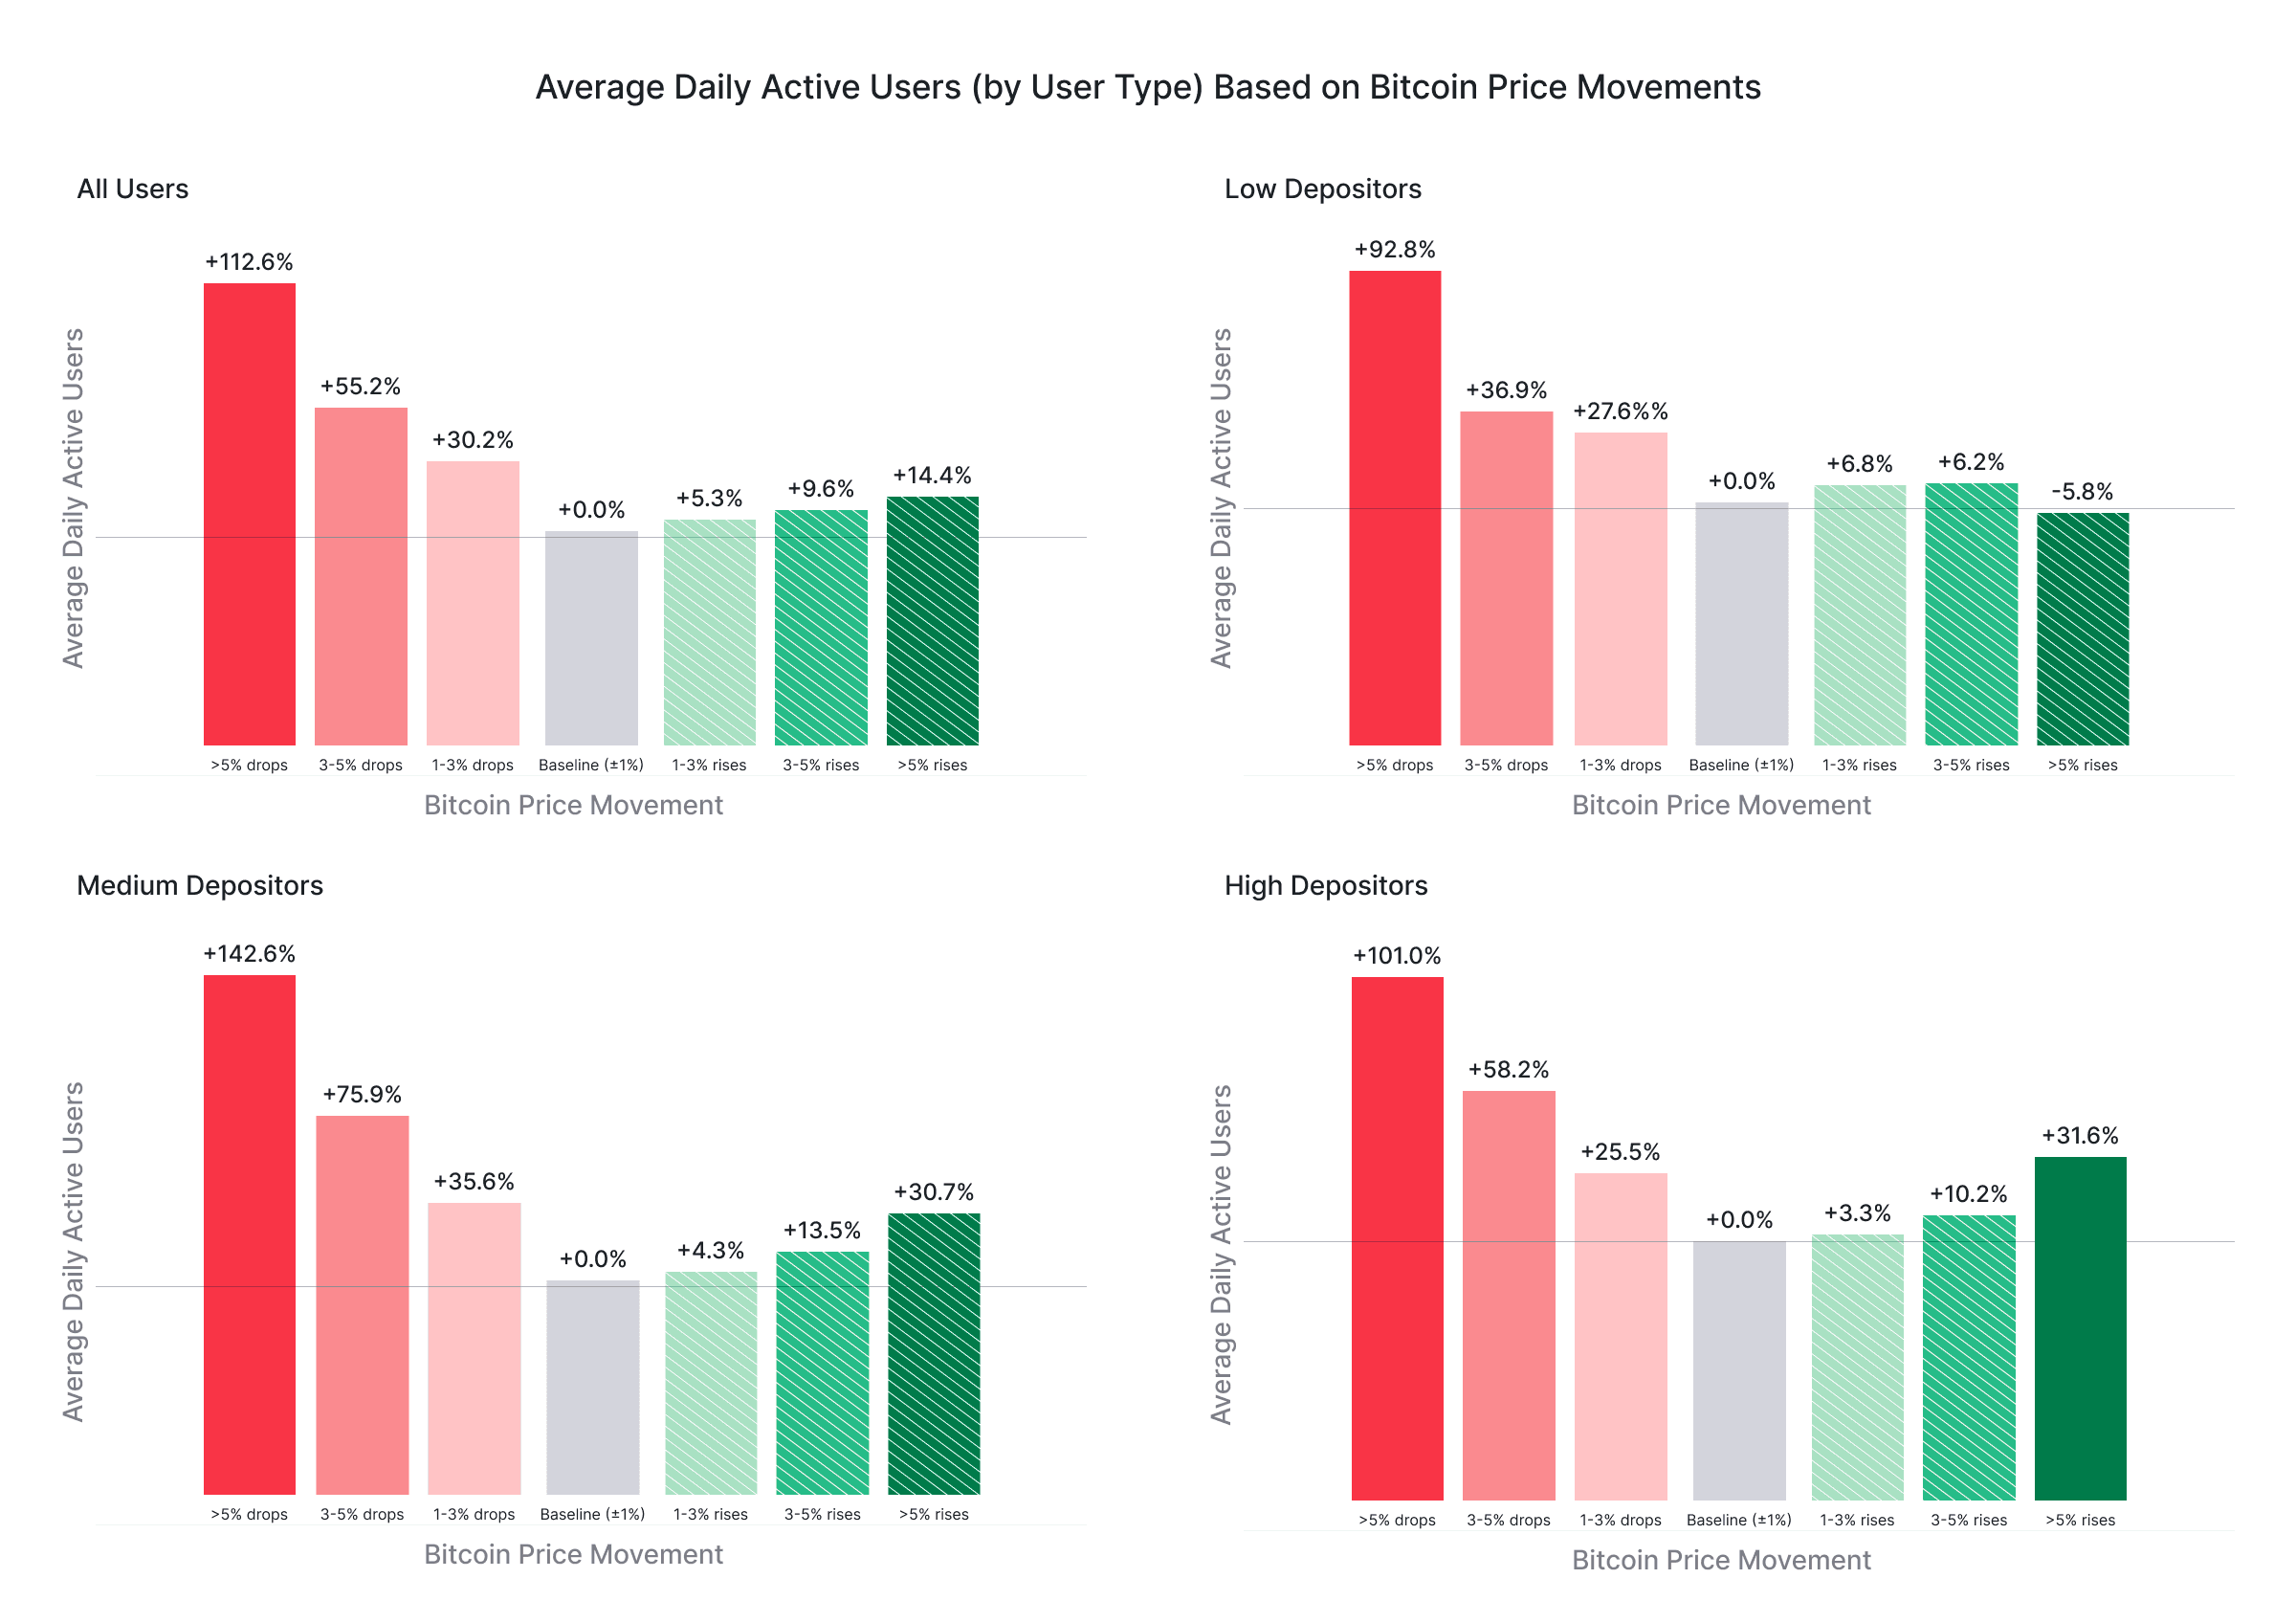
The relationship looks so perfect that we questioned whether a more affluent, sophisticated user class was driving these numbers.
Breaking down users into low, medium, and high depositors only reaffirmed our findings, revealing that all user groups display the same strategic behavior: increase deposits when Bitcoin drops, act normal when Bitcoin rises.
Across low, medium, and high depositing user classes, daily active users increase by up to 142% when Bitcoin plummets, while there are little to no significant changes in daily active users when Bitcoin rises, as compared to stable market conditions.
Timing only matters if you can execute
When Bitcoin drops, traders act immediately, moving 2-3x their typical capital within hours. Instant and reliable payments aren't just a convenience, they make the difference between executing a strategy and watching it slip away.
Lean’s instant account-to-account payment infrastructure enables traders to act the moment opportunities appear. Whether a user deposits $100 or $10,000, funds arrive immediately and can be deployed without delay. The payment layer becomes part of the strategy.
This behavior is not emotional, it’s tactical
Market stress reveals how participants truly behave.
In the UAE, Bitcoin downturns reveal a trading community that is fast, disciplined, and comfortable operating in real time. Traders do not treat falling prices as moments to step aside; they treat them as openings.
Experience also matters. These patterns repeat across multiple downturns throughout the year. The consistency suggests learned behavior rather than spontaneous reaction. Volatility is expected, and action is planned.
Together, these factors point to a market that has matured faster than many assume.
About the Analysis: This analysis examined 365 days of aggregated payment data from 1 January through 31 December, 2025, comparing daily payment volumes against Bitcoin's daily price movements across major crypto exchanges in the UAE. All findings represent aggregate user behavior patterns, not individual investor analysis. Data and analysis conducted by Lean Technologies.
Continue reading
Making Housing More Accessible: How Rize Used Lean’s Open Banking Data to Cut Rejection Rates From 60% to 38%
Lean Checkouts: Designed for Conversion
Rebuilding the moment every sale is won or lost
Lean Collections: Automated Repayments in the UAE
For businesses that collect repayments over time, reliability directly affects cash flow, operating cost, and customer experience.